On October 20, 2026, Wedgewood Polls, an emerging American polling outfit, admitted on the social platform X that the vast majority of the polls it had published had no real survey data behind them. The admission was prompted by an investigation by the election-data site FiftyPlusOne: after obtaining its raw data, reporters found the sample was abnormally “clean,” and the respondent IDs and transaction IDs did not follow the patterns of the survey platform it claimed to use. This article reviews what happened, how the data were checked and how polling aggregators screen pollsters, and lists items readers can check for themselves.
The “Vote Here” sign outside the polling place at Woodbury City Hall, Minnesota, on U.S. Election Day, November 3, 2020. Photo: Tony Webster. Source: Wikimedia Commons. License: CC BY 2.0.
What Happened with Wedgewood
According to Newsweek and The Guardian, Wedgewood Polls appeared in June 2026, describing itself as an independent election pollster. One of its earlier polls, on Louisiana’s Republican Senate primary, showed John Fleming leading Julia Letlow by 4 percentage points, while in the actual result on June 27 Letlow won by nearly 14 percentage points. On July 10, Washington Monthly columnist Bill Scher pointed out that the new outfit’s first poll had been wildly wrong.
On August 20, Straight Arrow News reported on its background: its website was built on Google Sites and listed no staff names, phone number or location; the site was registered on June 26, and its only social media account, on X, was also created in June. Wedgewood described itself as a two-person team that had not yet incorporated as a company. It declined to reveal who its members were on the grounds that one of them had been harassed online, and it also refused video calls. At the time, The New York Times’ polling database already included its results, but with the note “this pollster does not meet our criteria for select pollsters.”
In mid-October, Wedgewood released a Mississippi Senate poll: conducted October 12 to 14 among 511 likely voters, it showed incumbent Republican Senator Cindy Hyde-Smith leading Democrat Scott Colom by only 52% to 48%. According to Magnolia Tribune, Colom’s campaign promptly cited the poll in a press release. FiftyPlusOne’s Mary Radcliffe, G. Elliott Morris and Cooper Burton had received multiple tips about Wedgewood before, but this time the tip came with evidence, so they asked Wedgewood for the poll’s raw data. On October 20, FiftyPlusOne sent its findings to Wedgewood for comment. Rather than answer the questions, Wedgewood posted a statement on X admitting that the vast majority of its polls were not backed by real data. It called this a “social experiment” to expose gaps in how media outlets and aggregators vet pollsters, and said that only one crowdfunded Nebraska poll was real. For now, both the “social experiment” motive and the claim that the Nebraska poll was real rest only on Wedgewood’s own account.
Afterward, The New York Times removed all of Wedgewood’s polls from its poll tracker, Decision Desk HQ deleted 17 of them from its race lists and averages, Silver Bulletin announced a permanent ban, and Newsweek retracted 3 articles and corrected other coverage. Michigan State Senator Mallory McMorrow said that a Wedgewood poll in late June showing her support falling into single digits dried up her campaign donations and hurt her volunteers’ morale; she withdrew from the Senate primary on July 5. This account of the poll’s impact is her own.
FiftyPlusOne’s Data Check
According to FiftyPlusOne’s report (as quoted on Gelman’s blog), the reporters’ first impression on obtaining the raw data was that it was “surprisingly clean.” The unweighted sample was 67% white and 31% Black, already quite close to reasonable estimates for Mississippi (about 60% and 37%); the poll’s design effect was only 1.18. The design effect measures “how hard” the weighting has to work to make the sample representative: the more skewed the sample, the more spread out the weights must be, the higher the design effect, and the smaller the effective sample size. For example, if a sample has far too few young people, the few young respondents must be given very large weights, which amounts to letting a handful of people speak for a large group. By the usual conversion, 511 respondents with a design effect of 1.18 amount to an effective sample of about 433, a very small loss for an online survey.
A low design effect does not by itself mean fabrication. If quotas are set during recruitment, requiring the platform to return respondents from each group in proportion to the population, the raw sample can also be very close to the population. FiftyPlusOne therefore asked Wedgewood whether it had used quotas, because as far as they understood, quotas seemed to be the only way to control sample composition on Pollfish while a survey is in the field. Wedgewood said it had not, which made the unusually low design effect harder to explain. But the reporters also stated that this was still not enough to prove the data were made up.
The decisive evidence came from IDs automatically generated by the survey platform. Wedgewood said the poll had been conducted through the online survey platform Pollfish, so FiftyPlusOne paid out of its own pocket to replicate the Mississippi survey on Pollfish as closely as possible and obtain real data for comparison. In the real data, about half of the respondent IDs were plain strings of digits (e.g., “1234567890”) and half had a hyphen prefix (e.g., “-1234567890”); the transaction IDs tracked the time respondents submitted the questionnaire almost perfectly (in the report’s words, “almost 1:1 correlated”). The reporters confirmed with Pollfish that this was exactly the expected behavior of these two columns, and checked data from another organization that had used the platform, finding the same patterns. The data Wedgewood provided matched neither pattern, nor the platform’s description of these two columns.
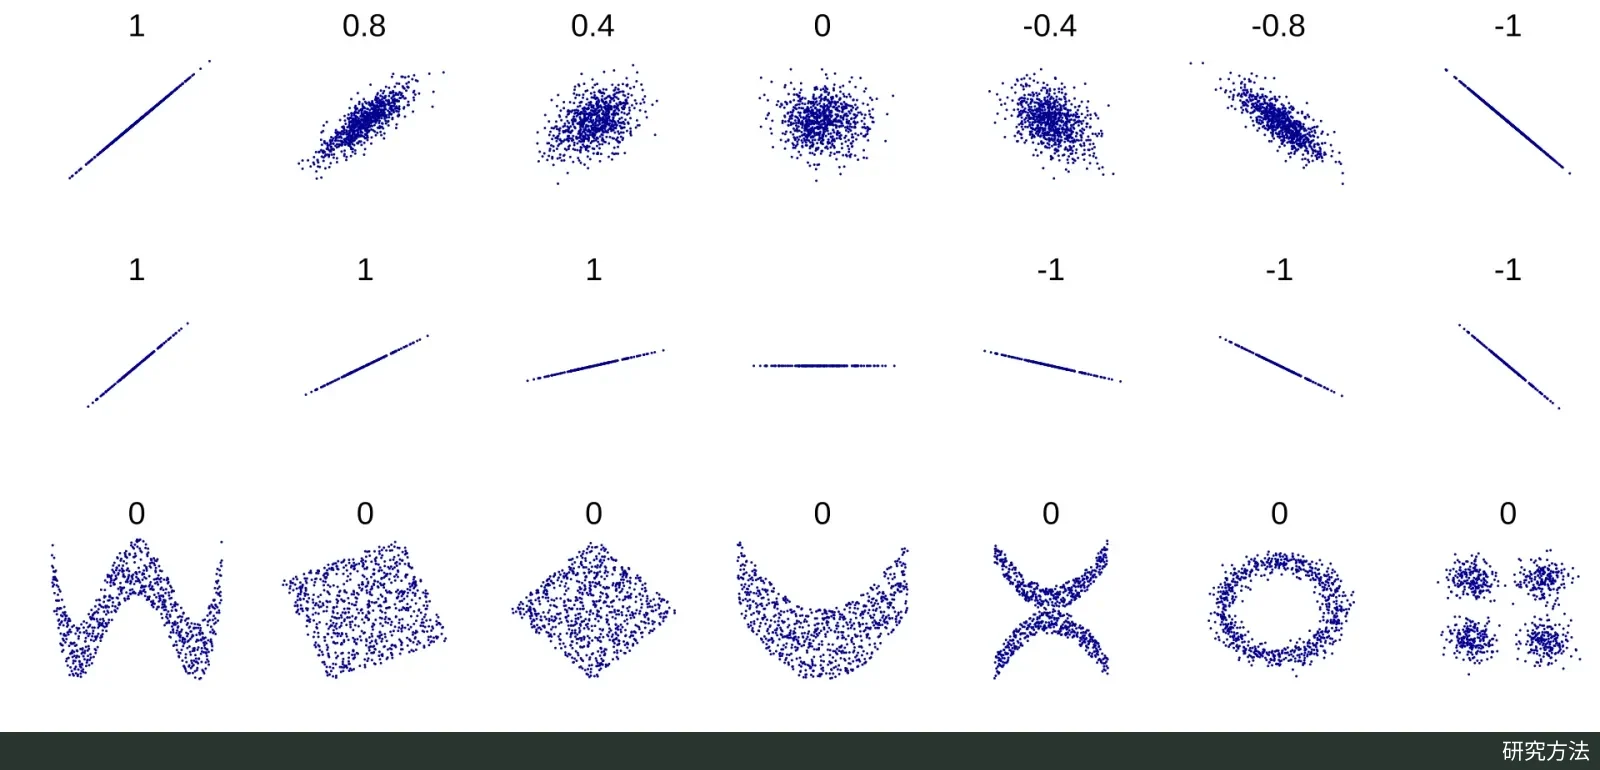
Example scatter plots for different correlation coefficients: at the far left of the first row the correlation is 1 and the points fall on a straight line; in the middle it is 0 and the points form a patternless cloud. According to the report, the relationship between transaction IDs and submission times in real Pollfish data is close to the former. This is a generic illustration, not data from FiftyPlusOne or Wedgewood. Image: DenisBoigelot (original uploader Imagecreator). Source: Wikimedia Commons. License: CC0.
It is a bit like checking a receipt: a forger can make the amount and items look very convincing, but is unlikely to think of imitating the fixed format of the cash register’s serial numbers or the way they increase over time. FiftyPlusOne stated that the ID patterns were only two of the “many factors” that raised its suspicions. The rest is in the paywalled part of the original article, which the author of this article was unable to read. In the freely available part, the report does not mention statistical tests such as checking the distribution of final digits.
Before this data check, FiftyPlusOne says it had already checked Wedgewood’s identity: Wedgewood provided two names, one of whom was independently confirmed to have worked in polling, and the reporters also read the methodology description on its website closely. In its statement, Wedgewood accused FiftyPlusOne, The New York Times and other aggregators of failing to vet properly; FiftyPlusOne says this claim is false. Silver Bulletin also says Wedgewood had previously answered questions from several aggregators about its identity, methods and funding, which is why it was included. Judging by the outcome, vetting based on self-reported materials was circumvented, and what ultimately worked was checking at the level of raw data.
Aggregators’ Screening Rules and the Blog Commentary
Polling aggregators usually do not audit raw data poll by poll; instead they decide whether to include a pollster, and how much weight to give it, based on the pollster’s characteristics. The explanation on The New York Times’ polling page says that pollsters that meet at least two of the following three criteria and conduct surveys for nonpartisan sponsors are classified as “select pollsters”: an accurate track record in recent elections; membership in professional polling organizations; and use of probability sampling. These factors affect each poll’s weight in the average. Wedgewood did not meet this standard, so although it was included, its polls always carried the “does not meet the criteria” notice.
Silver Bulletin’s explanation says its averages distinguish between registered voters and likely voters, adjust for each pollster’s systematic lean (house effect), and give more weight to more reliable polls; most of its election polls are drawn from The New York Times’ database. Rules like these rely mainly on pollsters’ self-reported information and track records. A new pollster has no track record yet and can fabricate its self-reported information, so this kind of screening can only do so much. FiftyPlusOne also warns in its report that AI tools make it increasingly easy to generate websites, PDFs and tables, so fakers can make their materials look as polished as those of legitimate research organizations.
On his blog, Gelman praised this as a successful application of data-journalism methods and offered two personal comments. First, Wedgewood said it was an “experiment” only on the very day it was exposed, which he considers “a bit suspicious.” Second, he reiterated a view he first put forward in 2004: there are too many polls in the United States, even counting only legitimate ones. The sheer number of polls wastes respondents’ time and also makes people less willing to take part in surveys that serve the public good, such as public health surveys. Polls and “horse-race” election coverage that cares only about who is ahead feed each other: polls supply headlines for such coverage, and such coverage spawns more polls. Fake polls mixed in only make things worse. These are Gelman’s views, not conclusions of the investigation itself.
Items Readers Can Check
The American Association for Public Opinion Research (AAPOR) Transparency Initiative lists the elements that should be disclosed when survey results are published; the initiative only requires disclosure and does not judge methodological quality. In light of this episode, when readers come across an unfamiliar poll, they can check the following items one by one. Note that these are only screening clues: meeting all of them does not prove the data are real. Wedgewood itself passed some vetting.
- Who conducted it and who paid: whether the sponsor and the organization that carried out the survey are named; whether it was commissioned by a candidate, party or advocacy group.
- Whether the organization can be verified: whether there are verifiable names of those in charge, an address and a phone number; when the website and social media accounts were created; whether it belongs to professional polling organizations or the AAPOR Transparency Initiative.
- Track record: how far the organization’s past polls were from actual election results. Wedgewood’s earlier Louisiana poll even got the leader wrong.
- Sampling method: whether it used probability sampling or an opt-in online sample; which platform, list or panel the sample came from.
- Questionnaire, timing and population: whether the exact question wording, interview dates, target population (all adults, registered voters or likely voters) and sample size are published.
- Weighting and error: whether it explains which variables were used for weighting; whether the margin of error accounts for the design effect. Under AAPOR’s requirements, a nonprobability sample that does not describe the model used should not report a measure of precision, and should instead explain why none is provided.
- Data quality control: whether it describes measures such as attention checks, removing respondents who answer too quickly, and preventing duplicate responses, and whether AI was used.
- Whether the results and timing are too convenient: whether the results happen to play into hot topics in public discussion, and whether the release timing is suspiciously convenient; when the raw data are available, whether the sample is abnormally “clean.” Clues like these only signal that further checking is needed; they are not, on their own, evidence of fabrication.
Generally only journalists and aggregators can check raw data, and only if they can obtain the data and have comparable real data as a reference. In this case, FiftyPlusOne ran its own survey on the same platform and compared the suspect data against the “fingerprint” of real data. For ordinary readers, the more practical course is to pay attention to how aggregators label pollsters and to treat polls of unclear origin with only a single result with caution.
References
-
Andrew Gelman. Real political reporters use data journalism techniques to catch fakers at “Wedgewood Polls”. Statistical Modeling, Causal Inference, and Social Science, 2026-10-20.
-
Mary Radcliffe, G. Elliott Morris, Cooper Burton. FiftyPlusOne just caught a pollster faking data — and they copped to it. FiftyPlusOne, 2026-10-20.
-
Lucy Campbell. Pollster admits to fabricating data for ‘social experiment’ to expose flaws of industry. The Guardian, 2026-10-21.
-
Newsweek Editors. Fake Polling Firm Duped Media in ‘Social Experiment’. Newsweek, 2026-10-21.
-
Azi Paybarah. Pollsters weather storm of fake data, secret sponsorships, with some afraid to give names. Straight Arrow News, 2026-08-20.
-
Frank Corder. Poll pushed by Colom claiming Senate race with Hyde-Smith is “tied” was fake, fabricated. Magnolia Tribune, 2026-10-20.
-
Nate Silver, Eli McKown-Dawson. 2026 Midterm Election Forecast: Senate & House. Silver Bulletin, updated 2026-10-21.
-
The New York Times. President Trump Approval Rating: Latest Polls (About our polling averages). Publication date not stated.
-
American Association for Public Opinion Research. Transparency Initiative. Accessed 2026-10-22.
-
Research Methods · Rituals can be imitated; understanding cannot be faked
-
Compiled and published by Scholay, the all-in-one academic platform. If any content infringes your rights, please let us know and it will be taken down.
-
Also published on EnterScholar, a community for scholars in the age of AI